Reference
Nies, M., McEwen, M. (2020). Epidemiology. In Community and Public Health Nursing (2nd Philippine ed., pp. 139-166). C&E Publishing, Inc.
Epidemiology is defined as “the study of the distribution and determinants of health-related states of events in specified populations, and the application of this study to the prevention and control of health problems” (Last, 2001). This definition clearly states that the focus is the population (not individuals), whether at the global level, country, city, school or neighborhood. It also shows that the scope covers not only diseases, but also health-related states and events; described in terms of distribution (frequency or pattern) including their determinants (risk factors or causes), and their prevention and control.
The Father of Epidemiology
John Snow is considered as the father of field epidemiology, having conducted studies of cholera outbreaks to discover the cause of disease and to prevent its recurrence in 1854. He was able to infer that water was a source of infection for cholera by determining where the persons with cholera lived and worked.
Epidemiology in Public Health Nursing
Epidemiology is the basic science of public health, providing the foundation for directing practical and appropriate public health action based on this science and causal reasoning. Public health nurses use epidemiology to describe the distribution and extent of health condition or disease in the population, identify the risk factors in studying natural history of diseases or models of disease causation, monitor health condition or disease through screening and surveillance, and evaluate approaches or interventions that reduce disease risk and promote health.
Definition of some terms:
- Frequency: the number of health events, such as the number of cases of pneumonia in a population. Rate (over time) and ratio (over population) may also be used to represent the data.
- Pattern refers to the occurrence of health conditions or disease by time (annual, seasonal, weekly, daily, etc.), place (urban/rural, schools, workplace, etc.), and person (demographics, age, sex, marital status, etc.). Classifying health events by time, place and person is also called descriptive epidemiology.
- Determinants include demographic characteristics, genetics, behavior, or environmental exposures. Analytic epidemiology provides answers to assess whether groups with different rates of health conditions or diseases differ with these determinants. These findings provide evidence for public health control and prevention measures.
- Communicable Diseases (CDs) are those spread from one person to another through a variety of ways; such as, physical contact with an infected person, contaminated food or water, bites from insects or animals capable of transmitting the disease, and breathing in an airborne virus.
- Noncommunicable Diseases (NCDs) are chronic diseases which are the result of a combination of genetic, physiological, environmental, and behavioral factors. The main types of NCDs are cardiovascular diseases (heart attacks and stroke), cancers, chronic respiratory diseases (asthma, chronic obstructive pulmonary diseases) and diabetes.
- Emerging Infectious Diseases are infections recently appearing within a population or those whose incidence or geographic range is rapidly increasing or threatens to increase in the near future.
- Disease Occurrence: the relative incidence, location, and frequency of disease allows it to be classified as the following:
- Sporadic: infrequent, irregularly occurring disease.
- Endemic: constant presence of a disease within a locality.
- Hyperendemic: persistent, high levels of disease occurrence within a locality.
- Epidemic: an increase, often suddenly, in the number of cases of a disease above what is normally expected in a locality.
- Outbreak: similar to an epidemic, but limited within a smaller geographic boundary.
Natural History of Disease
In studying the course and outcome of diseases, epidemiology gives a picture of a natural history of diseases in individuals and groups. It describes the sub-clinical changes to signs and symptoms of the clinical disease until its resolution to either recovery or death.
- An exposure is when a pathogen enters a susceptible host. The pathogen then invades the target organ or tissue and begins multiplying.
- When the host’s immune system responds, there is already an acknowledged infection whether symptomatic or not. Between the exposure and infection, the duration is called the latent period. As soon as infection occurs, the possibility of infecting others begins; the disease is in its infectious period. When this ceases, then disease enters its non-infectious period.
- Between the exposure and the appearance of symptoms, the duration is called the incubation period.
Models of Disease Causation
It is important to understand the risk factors or any attribute, characteristic, or exposure of an individual that increases the likelihood of developing a disease or health condition. This is imperative for providing preventive and control measures. There are three models primarily used by epidemiology:
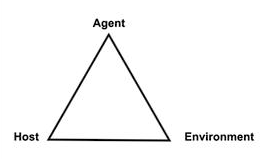
- Epidemiologic Triad or Triangle: the traditional model for infectious (communicable) diseases, consisting of a susceptible host, an external agent, and an environment that brings the host and agent together. Disease results from the interaction between the susceptible host and the agent in an environment that supports transmission of the agent from a source to that host.
- Agent refers to infectious microorganism or pathogen present for the disease to occur. It could also be chemical contaminants or physical forces. The presence of an agent is not always sufficient to cause disease. Hosts may not be susceptible to a particular agent, or the environment may not be conducive for the agent to thrive.
- Iceberg Principle: this model states that diagnosed cases of a disease is only “the tip of the iceberg”, and that a large number of cases at a given time are subclinical. The public health goal is to find out through screening and early detection those who are exposed or affected so that proper interventions can be done. For example, the recorded cases of suicide are the tip of the iceberg, and that efforts can be pointed towards those with depression before they resort to suicide.
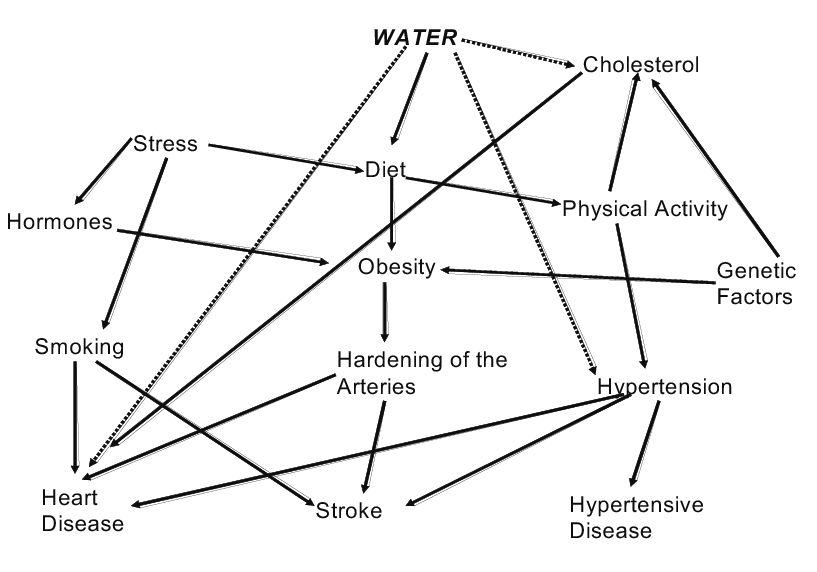
- Web of Causation: a web-like illustration of different multiple factors that contribute to the cause of a disease. This model proposes that disease are caused by the interaction between genetic factors and environmental factors.
Screening and Surveillance
Screening is the active search or process of detection for disease or disorders among apparently healthy people. The primary aim of screening is to identify risk factors and diseases in their earliest stage. Screening of whole populations aims to detect those at risk of a specific disorder or condition who are likely to benefit from further investigations and possible treatment or action to prevent the disorder or condition or its consequences.
- Some examples include breast cancer screening, cervical cancer screening, lung cancer, and newborn screening.
Surveillance is the systematic, on-going, and analytic process of monitoring to scrutinize disease condition. Surveillance involves investigating the distribution and possible causes of disease and conditions within the population. Information from surveillance inform planning ang improving health services and understanding the factors that contribute towards disease, as well as the long-term effects of these diseases.
- Event-based surveillance is used for rapid detection, notification, verification and assessment of public health events such as clusters of disease, or rumors of unexplained deaths
- Indicator-based surveillance involves routine reporting of cases of disease such as notifiable disease surveillance systems.
Levels of Prevention in Epidemiology
- Primordial Prevention: at a very early stage, this is prevention of even risk factors to exist in the first place. This includes activities that promote healthy lifestyles, and avoiding the development of behaviors and exposure patterns that contribute to increased risk of disease. For example, advising parents to quit smoking for the sake of their child’s health.
- Primary Prevention: the control of exposure to risk factors, before disease development. This relies on epidemiological information to indicate those behaviors that are either protective, and those that are associated with increased risk. Actions designed to promote healthy lifestyle and environment are called health promotion activities; while those aimed at reducing the risk of specific diseases are called health protection.
- Secondary Prevention: the application of available measures to detect diseases early or health conditions before the onset of signs and symptoms. Screening and physical examinations that are aimed at early diagnosis (e.g., mammography, cervical screening, regular blood pressure testing) are examples of secondary prevention.
- Tertiary Prevention: managing disease after diagnosis to slow or stop disease progression and limit disability or complications. Epidemiological studies examine risk factors affecting function and suggest strategies in the care of patients such as chemotherapy, rehabilitation, and screening for complications.
Evaluating Interventions
Epidemiologic methods are also used in evaluating the effectiveness and efficiency of interventions. There are population-based approach interventions which attempt to change socio-cultural or structural factors in the community, cities, or even at a national level; an example of which is smoking bans in public places. There are also high-risk approach interventions, which targets high-risk persons; those likely to have increased incidence of disease based on the presence of risk factors.
Epidemiological Studies
Descriptive Epidemiology focuses on describing disease distribution by characteristics relating to time, place, and people. This could be done through review of records, routine data collection, or ecological surveys. It examines factors like age, sex, education, socioeconomic status, or availability of health services. The primary considerations for descriptive epidemiology are frequency and pattern. Frequency evaluates the rate of occurrence, and pattern helps analytical epidemiologists suggest risk factors.
- Describing the person means looking into inherent characteristics (sex, age), acquired characteristics (marital status, immune status), activities (occupation, tobacco use, alcohol, exercise), and other conditions (socio-economic status, access to care).
- Time could be about secular trends, or seasonality or days of the week of the health related event.
- Place means geographic location, urban or rural, and others that give orientation to space.
Analytic Epidemiology aims to understand the quality and amount of influence that determinants have on the occurrence of disease or health-related event. This is usually done by group comparisons. The epidemiologist looks for factors that might have preceded the disease or event.
- Cross-sectional Study: an examination of the relationship between health problems and other variables of interest as they exist in a defined population at one particular time. Exposure and outcome are measured at the same time. This creates temporal ambiguity; hence, causal relationship cannot be established. This is used to get baseline data, determine the magnitude of the health problem or disease, or evaluate medical care or health service delivery.
- Cohort Study: a longitudinal study. Subjects are selected based on exposure status, being disease-free at the beginning of the study. The cohort is followed through time to determine the later outcome status.
- Case-control Study: a retrospective study. Subjects are selected based on disease status, then compared to subjects without such a disease status. The past exposures or risk factors of these two groups are then compared.
Experimental Epidemiology uses an experimental design to confirm a causal relationship suggested by observational studies. Experimental epidemiologic studies control factors to reveal unbiased relationships between exposures and outcomes, e.g., exposure to smoking relating to an outcome measure of hypertension. These test a hypothesis about a health problem or treatment.
- Randomized Control Trials (RCT) are experiments with patients as subjects to evaluate a potential cure for a disease and prevent death and disability. These are the most stringent way of determining the cause-effect relationship
- Field Trials: experiments done in the field involving subjects free of the disease or health condition, but at a high risk of contracting them. These tests are done to determine if interventions are effective in reducing the risk of developing the disease or condition. These are more expensive due to the locality and number of subjects.
- Community Trials: an extension of field trials, involving the whole community as the unit of assignment. For example, water treatment is done at the community level through water supplies. This intervention can be evaluated by involving entire communities who were assigned the water treatment.
Sources of Data
Epidemiologists collect and analyze data in doing the different types of epidemiologic studies. These may be primary or secondary:
- Primary data: original data collected for a specific purpose by a researcher. An example of this is with water samples and interviews collected during a cholera outbreak.
- Secondary data: data already collected by other individuals and/or institutions for some specific purpose. Examples of these include population census, birth and death certificates, disease registries, patients’ medical records, health insurance claims, health surveys, etc. Many of these are from government agencies such as the Department of Health.
- Population census: the total process of collecting, compiling, evaluating, analyzing, and publishing or otherwise disseminating demographic, economic and social data pertaining, at a specified time, to all persons in a country or in a well delimited part of a country. In the Philippines, this is done every five years (previously 10 years, amended by E.O. 352) and the results are used to allocate congressional seats and government program funding. The next census is scheduled for the year 2020.
- Civil Registration and Vital Statistics (CRVS) are “those systems which produce births, deaths and causes of death information, which are of fundamental strategic importance for countries’ development process and governance” (Mikkelsen, 2012). It is important that CRVS involve continuous, timely, accurate, consistent and complete registration and reporting of all human beings’ life vital events such as birth, marriage and death in a given population using globally accepted standards. This helps in (1) defining patterns, trends, and impact inclusive of the causes of mortality; (2) understanding emerging health issues and challenges; (3) defining appropriate and relevant health-sector reforms, poverty reduction and development efforts; and (4) defining baseline levels and monitor and track progress towards both national and international development goals and assess effectiveness of health programs.
- The population growth was 1.5% by the year 2022, and is generally decreasing.
- Disease or Patient Registries: collections of secondary data related to patients with a specific diagnosis, condition, or procedure. They are “organized systems that use observational study methods to collect uniform data (clinical and other) to evaluate specified outcomes for a population defined by a particular disease, condition, or exposure and that serve predetermined scientific, clinical or policy purposes” (Agency for Healthcare Research and Quality, 2019)
- Disease surveillance and notification may be on an individual, local, national, and international level. It is used for strategizing for the prevention and control of diseases most especially epidemic prone diseases. Disease surveillance is the continuous scrutiny of occurrence of disease and health-related events to enable prompt intervention for the control of diseases. These are primarily developed for monitoring diseases of high burden, detecting disease outbreaks that could escalate into epidemic proportions, and monitoring progress toward attainment of targets for the control, elimination, or eradication of a specific disease. It may be passive (reports are received by the health agency) or active (the agency actively contact the population to obtain information). Disease notification is an integral part of disease surveillance, involving the official and timely reporting of the occurrence of specific diseases and conditions to designated public health authorities by clinicians and other health personnel for action using designated reporting tools. There are four critical diseases which are deemed always to be unusual or unexpected and may have serious public health impact, and hence must be notified to WHO in all circumstances: smallpox, poliomyelitis due to wild type poliovirus, human influenza caused by a new subtype, and severe acute respiratory syndrome (SARS). Prompt reporting of cases of infectious diseases and other events of potential public health threat could prevent potential outbreaks which would result in a high rate of morbidity and mortality.
- The Philippine Integrated Disease Surveillance and Response (PIDSR) is an enhanced surveillance that monitors notifiable diseases and other health-related events of public health importance utilizing an integrated approach. It integrates health statistics generated through the major disease surveillance systems in the country; name: Notifiable Disease Reporting System (NDRS), Field Health Services Information System (FHSIS), National Epidemiology Sentinel Surveillance System (NESSS), Expanded Program on Immunization Surveillance System (EPI Surveillance), and HIV-AIDS Registry.
- The Unified Registry Systems on Chronic Noncommunicable Diseases, Injury Related Cases, Persons with Disabilities, and Violence Against Women and Children serve as tools and mechanisms to collect information on reportable cases on chronic noncommunicable diseases, injuries, violence, and disabilities that have been diagnosed or confirmed in the country.
- Population-based surveys are useful for disease surveillance when they ask people about information for which they may be the most valid and reliable source; e.g., their own private behaviors, attitudes, or mental health status, or for which they can report with reasonable reliability, even if they are not the only or most valid source of information. Some examples of health surveys in the U.S. are:
- Behavioral Risk Factors Surveillance System (BRFSS)
- Youth Risk Behavior Surveillance System (YRBSS)
- National Health Interview Survey (NHIS)
- In the Philippines, the National Nutrition Survey (NNS) is the key source of data for the national government not just on nutrition-related information but on health matters as well. These determine and evaluate the food intakes, nutrition and health status of Filipinos, and provide official statistics on food, nutrition and health situations of the country.
Vital Statistics
Vital statistics is the study of the characteristics of human populations. It comprises a number of important events in human life including birth, death, fetal death, marriage, divorce, annulment, judicial separation, adoption, legitimation, and recognition. Some of these vital statistics are used in identifying health-related concerns and planning for interventions at the community or country level. Their subsequent analysis and interpretation are essential for setting targets and evaluating social and economic plans, including the monitoring of health and population intervention programs, and the measurement of important demographic indicators of levels of living or quality of life, such as expectation of life at birth and the infant mortality rate. The health sectors depends on patterns and causes of mortality and morbidity to identify emerging health threats and possible high risk groups for selecting priority interventions and allocating resources.
Individual Records
The collection of vital statistics is included in the civil registry system. Vital statistics is important as a legal document for the person named as well as a document to describe the demographics and health of populations. The most important individual records include birth, death, marriage/divorce. They are also used for program planning, such as in maternal and child health services, child immunization programs, epidemic or outbreak investigations and assessment of causes of accidents and injuries.
- Birth record is a legal document establishing name, parentage, birth date, order of birth, legitimacy, citizenship, nationality, geographic place of birth. Many individual rights and entitlements are dependent on the birth record, such as entry to school, driver’s license, passport issuance, tax/insurance benefits, etc.
- Death record is a documentary proof surrounding the death of the person such as time and place of death as well as medical cause of death. Proof of death and the associated facts are usually used for property inheritance rights and right to remarry of surviving spouse.
- Marriage and divorce records are usually needed for social and economic programs, tax privileges for couples, alimony, change of nationality, and right to remarry.
- Records on adoption, legitimation and recognition are used for determining rights of individuals (children, parents, guardians), which may vary from one country to another.
Population Records
Vital records of populations serve as key demographic variables in the analysis of population size, growth and geographic distribution. Population census can show population size and growth trends, as well as socio-economic concerns such as health, housing, education, family structure, occupation, and income. For example, “Life expectancy at birth” is used to compare the overall effects of mortality and its determinants. “Cause of death” is also important as it provides the foundation upon which more research is needed.
Population Indicators
Population indicators include population growth indicators (crude birth rate, general fertility rate, total fertility rate, and annual growth rate) and other population dynamics (migration) that can affect the age-sex structure of the population.
- Crude Birth Rate (CBR): the absolute rate at which the population grows. It is the most frequently used overall measure of the reproduction of a population. It is termed as “crude” because this value counts the total population including men, children, and the elderly who are not capable of giving birth. Like the Crude Death Rate (CDR), the CBR is widely used because of its availability of data which go into its computation.
- , where is the total number of live births for a given area and time period, is the total population at the midpoint of the time period, and is a constant, usually taken as 1000.
- A CBR greater than or equal to 45 live births per 1000 population implies high fertility, while a level less than or equal to 20 live births per 1000 population implies low fertility.
- General Fertility Rate (GFR): is the number of live births per 1000 women aged 15 to 49 in a given year.
- , where is the number of registered live births in a year, is the midyear population of women 15 to 49 years of age, and is a constant, usually taken as 1000.
- A GFR greater than or equal to 200 live births in 1000 women implies high fertility, while a level less than 60 live births in 1000 women implies low fertility.
- Population Pyramid: a graphical representation of the age-sex composition of the population. The shape of the pyramid provides insights into the fertility and mortality patterns of the population as well as the health services likely to be needed based on the age-sex composition of the population.
- A normal triangular shape of a population pyramid is characteristic of developing countries whose population has a larger proportion of younger age groups. This implies that more health services are needed for the young populations, such as immunization, nutrition programs, and environmental measures to prevent common childhood illnesses.
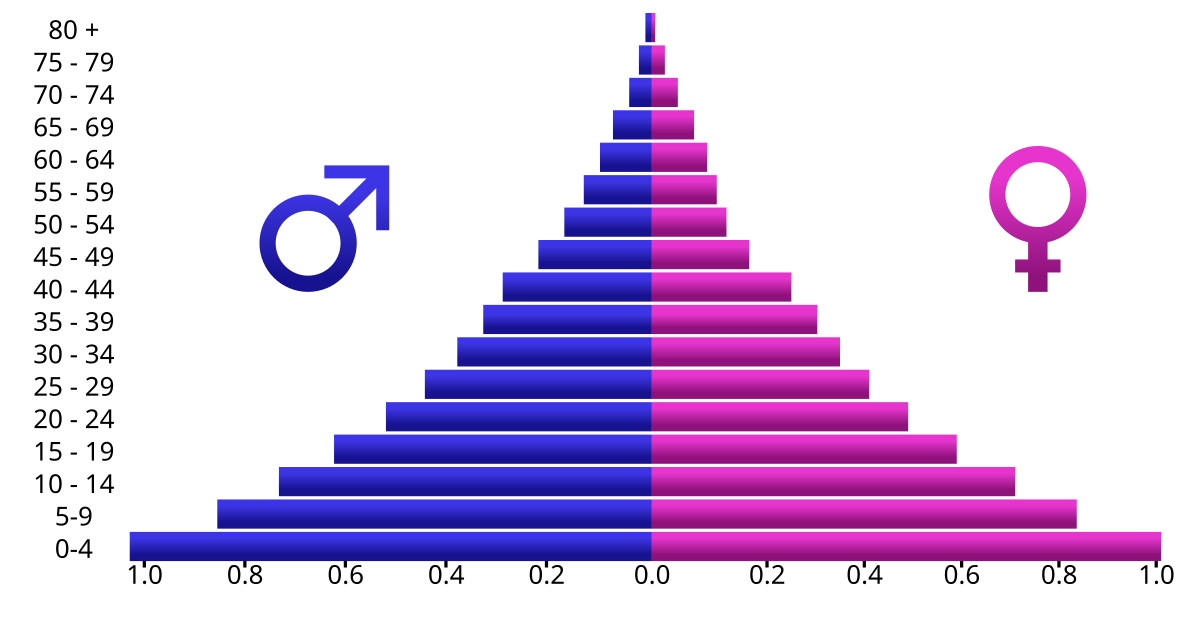
- A normal triangular shape of a population pyramid is characteristic of developing countries whose population has a larger proportion of younger age groups. This implies that more health services are needed for the young populations, such as immunization, nutrition programs, and environmental measures to prevent common childhood illnesses.
Live Birth
A live birth is defined as the complete expulsion or extraction from its mother of a product of conception, irrespective of the duration of the pregnancy, which, after such separation, breathes or shows any other evidence of life, such as beating of the heart, pulsation of the umbilical cord, or definite movement of voluntary muscles, whether or not the umbilical cord has been cut or the placenta is attached.
Mortality Indicators
Mortality indicators provide important information of the health status of the people in the community. A mortality rate is a measure of the frequency of occurrence of death in a defined population during a specified interval.
- Crude Death Rate (CDR) is the rate with which mortality occurs in a given population. CDR are sensitive to the number of people at the highest risk for dying. A relatively older population will likely produce a higher CDR. It is often expressed as the number of deaths per 1000 persons for a specified place for a given year.
- , where is the number of deaths in a given area and time period, usually a calendar year, is size of the population at risk of dying, and is a constant, usually taken as 1000.
- The Philippine CBR in 2016 was ~6 persons per thousand population.
- Specific Death Rate (SDR) is a subset of CDR representing a particular class of deaths. If based on age, termed as age-specific death rate; on gender, sex-specific death rate; on cause of death, cause-specific death rate.
- , where is the number of deaths occurring in the th class in a given area and time, is number of persons in the th class of the population in the same area and time, and is a constant, usually 100000.
- In the Philippines, the age-specific death rate has an early peak in infants, then lowers in children before slowly increasing again through adulthood and the elderly.
| Cause of Death (PSA, 2016) | Frequency | Percent |
|---|---|---|
| Ischemic heart diseases | 74,134 | 12.7 |
| Neoplasms | 60,470 | 10.4 |
| Pnuemonia | 57,809 | 9.9 |
| Cardiovascular diseases | 56,938 | 9.8 |
| Hypertensive diseases | 33,452 | 5.7 |
| Diabetes mellitus | 33,295 | 5.7 |
| Other heart diseases | 28,641 | 4.9 |
| Respiratory tuberculosis | 24,462 | 4.2 |
| Chronic lower respiratory infections | 24,365 | 4.2 |
| Diseases of the genitourinary system | 19,759 | 3.4 |
- Proportionate Mortality Ratio (PMR) describes the proportion of deaths in a specified population over a period of time attributable to different causes. It may be calculated for any class of deaths, but their most common uses are for given causes or group of causes of death expressed as percentages of deaths from all causes, or for deaths at a specified age expressed as percentages of deaths at all ages.
- , where is the number of deaths occurring in the th class in a given area and time, is total number of deaths in the same time period, and is a constant, usually 100 or 1000.
- Maternal Mortality Rate (MMR) refers to the deaths related to pregnancy or childbirth. This is affected by maternal health practices, diagnostic ascertainment, and completeness of registration of births.
- , where is the number of direct maternal deaths in a specified time period, usually one year, is the number of indirect maternal deaths in the same period, is the number of live births in the same period, and is a constant, usually 10000 or 100000.
- Infant Mortality Rate (IMR) refers to the number of deaths per 1,000 live births of children under one year of age. It is considered as one of the important indicators of the overall level of health and social well-being of a country or other geopolitical area since many causes of death at this age group are considered to be preventable through adequate prenatal care, good nutrition for women and infants, and improved control of the environment.
- , where is the number of deaths to liveborn infants under one year of age during a specified time period, usually one year, is the total number of live births during the same time period, and is a constant, usually 1000.
- Neonatal Mortality Rate (NMR) refers to the number of deaths per 1,000 live births of children within 28 days postpartum. These deaths are due mainly to prenatal or genetic factors, while those in later months are influenced by environmental and nutritional factors as well as infections.
- , where is the number of deaths to liveborn infants under one month of age during a specified time period, is the total number of live births during the same time period, and is a constant, usually 1000.
- Postneonatal Mortality Rate (PNMR) refers to the number of deaths per 1,000 live births of children aged 29 days to 1 year.
- , where is the number of deaths to liveborn infants between one month and one year of age during a specified time period, is the total number of live births during the same time period, and is the same constant used in NMR, usually 1000.
- Early Postneonatal Mortality Rate (EPNMR): neonatal deaths may be partitioned into those dying within the first week of life and the remainder that survive the first seven days but die before one month of age. The risk of dying in the first week of life is measured by the EPNMR.
- , where is the number of deaths to liveborn infants dying within one week of age during a specified time period, is the total number of live births during the same time period, and is the same constant used in NMR, usually 1000.
- Perinatal Mortality Rate (PeMR): a combination of the deaths of fetuses of specified gestational age with deaths of liveborn infants who die in their first week of life.
- , where is the number of deaths of fetuses of 22 or more weeks of gestation plus deaths of liveborn infants of less than 7 days of age during a specified period, usually a calendar year, is the number of fetal deaths of 22 or more weeks of gestation during the same period, is the number of live births during the same period, and is a constant, usually 1000. comprises total births.
Patterns of Occurrence and Distribution of Disease
The central goals of epidemiology are describing the disease patterns, identifying the etiological factor in disease development, and taking the most effective preventive measures. In describing disease patterns and occurrence, two important concepts must be understood: risk and rate.
- Risk refers to the probability or chance of an adverse effect. Risk factor refers to specific exposure factors; such as high cholesterol, lack of physical activity, cigarette smoke, hypertension, and excessive stress, which are known risk factors for noncommunicable diseases. Risk factors may also be intrinsic factors or fixed characteristics of people; such as: age, sex, genetic make-up. Disease patterns are described as aggregates, with the effect of risk factors measured in disease rates.
- Rate is a population proportion in which the numerator is the number of events occurring in a specified period and the denominator consists of those in the population at the specified time period, multiplied by a constant (), i.e., a rate can be the number of cases of a disease occurring for every 100,000 people in the population. Rates allow for meaningful comparison of magnitude of health problems or diseases across countries, groups, or time periods.
Morbidity Rates
Morbidity is any departure, subjective or objective, from a state of physiological or psychological well-being.” in practical language, it comprises disease, injury, and disability. Morbidity rates can refer to incidence or prevalence:
- Incidence denotes the proportion of initial cases of a disease to a population; an incidence rate. It describes the occurrence of new cases in a disease or condition in a community over a given period relative to the size of the population at risk for that disease or condition during that same period.
- The incidence rate is considered as the most sensitive indicator of the changing health of a community because it entails the follow-up of a cohort of disease-free people who are at risk of developing the disease of interest within a specified period of time and thereby captures the fluctuations of disease in a population. It is valuable for monitoring trends in chronic disease, useful for detecting short-term changes in acute disease such as influenza or measles, and evaluating the effectiveness of health interventions.
- “Attack Rate” is often used for specific infectious diseases at a given time in place, as it measures the number of new cases of a disease in those exposed to the disease.
- Prevalence denotes the proportion of initial and existing cases of a disease to a population; a prevalence rate. It describes the number of all cases of a specific disease or condition in a population at a given point in time relative to the population at the same point in time.
- “Point prevalence” is a prevalence rate during a specific point. “Period prevalence” is a prevalence rate during a period or interval of time.
- Prevalence proportion measures the total number of existing cases of a disease at a particular point in time divided by the number of people at that point in time, e.g., during an examination ()
Changes in incidence or prevalence may result from some of the following:
- Changes in local reporting procedures or policies
- Changes in case definition
- Increased health-seeking behavior (e.g., media publicity prompts persons with symptoms to seek medical care)
- Increase in diagnosis
- New laboratory test or diagnostic procedure
- Increased physician awareness of the condition
- Increase in reporting (i.e., improved awareness of requirement to report)
- Outbreak of similar disease, misdiagnosed as disease of interest
- Laboratory error
- Batch reporting (i.e., reports from previous periods are held and reported all at once during another reporting period)
| Diseases (DOH, 2010) | Number | Rate |
|---|---|---|
| Acute respiratory infection | 1,289,168 | 1371.3 |
| Acute lower respiratory tract infection and pneumonia | 586,186 | 623.5 |
| Bronchitis/Bronchiolitis | 351,126 | 373.5 |
| Hypertension | 345,412 | 367.4 |
| Acute watery diarrhea | 326,551 | 347.3 |
| Influenza | 272,001 | 289.3 |
| Urinary tract infection | 83,569 | 88.9 |
| TB, respiratory | 72,501 | 77.1 |
| Injuries | 51,201 | 54.5 |
| Diseases of the heart | 37,589 | 40.0 |
Conducting Epidemiologic Investigations
- Defining Disease Outbreak: “the occurrence of cases of disease in excess of what would normally be expected in a defined community, geographic area or season” (WHO, 2012). The following may be utilized to determine an outbreak:
- Review of surveillance data - an outbreak may be detected during regular conduct and timely analysis of surveillance data.
- Observation of single events or clusters - cases of communicable diseases are reported by laboratories and healthcare providers to health departments.
- Reports from patients or members of the community - individuals that report to the hospital, e.g. a sudden spike in patients reporting diarrhea after attending a party, or a local citizen calling about a mysterious disease affecting their neighborhood.
- Factors Affecting Disease Outbreak Investigation: investigation is needed to identify and eliminate the source of disease/health condition and prevent occurrence of more cases.
- Factors related to the disease or health problem - these include the severity of illness, the number of cases, the source, mode or ease of transmission, and the availability of prevention and control measures. That is, investigation is more likely if there are a large number of affected persons, when the disease is severe, when effective control measures exist, and when the outbreak has the potential to affect others unless prompt control measures are taken.
- Factors related to the health department - availability of staff and resources, and competing priorities; if a health department is experienced in investigating outbreaks.
- Factors related to external concerns - other concerns include (1) control or prevention of the health problem, (2) opportunity to learn or do research, (3) public, political, or legal concerns, (4) public health program considerations, and (5) training in field epidemiology.
Steps in Disease Outbreak Investigation
The CDC (2012) outlines the steps in disease outbreak investigation. The steps listed are ordered conceptually though, in practice, some of the steps may be done at the same time; or a different ordered may be followed; such as, in cases where diagnosis and existence of an outbreak is established first before an outbreak investigation is decided upon, or control measures are implemented as soon as the source and mode of transmission are known.
- Prepare for field work: gain background knowledge on the disease or condition, supplies, and equipment required for the investigation. Plan with a team and coordinate with the local area.
- Establish the existence of an outbreak: the expected number is usually the number from the pervious few weeks or months, or from a comparable period during the previous few years. For a notifiable disease, the expected number is based on surveillance records. Local data may also be used for other diseases. A survey of the community may be conducted to establish the background of the disease or condition.
- Verify the diagnosis: this ensures the disease has been identified, and to ensure that laboratory error is not the source of increasing cases.
- Construct a working case definition: a case definition is a tool for classifying someone as either having or not having the disease of interest. These include clinical criteria and restrictions by time, place and person. In early investigation, case definitions are usually operationalized: (a) suspect case has a few typical clinical features, (b) probable case has typical features, and (c) confirmed case has typical features and laboratory verification. This minimizes false-positive and false-negative error cases.
- Find cases systematically and record information: passive surveillance (send out information about the outbreak and ask for reports) or active surveillance (visit facilities to collect information about the outbreak). Forms, questionnaires, or snowball sampling may be used.
- Perform descriptive epidemiology: characterize the outbreak by time, place, and person (descriptive epidemiology). This can be the basis for testable hypotheses, and provide directions for prevention and intervention measures.
- Develop hypotheses: may address the source of the agent, the mode of transmission, or the exposures that caused the disease, depending on what is known.
- Evaluate hypotheses epidemiologically: evaluate hypotheses by (a) comparing them with established facts, or (b) using analytic epidemiology to quantify relationships and assess the role of chance. The necessity of analytical epidemiology (retrospective cohort studies, case-control studies) depends on the amount of evidence supporting the hypotheses.
- As necessary, reconsider, refine, and re-evaluate hypotheses: if the results of analytic epidemiology are unrevealing, rethinking the hypothesis may be necessary.
- Compare and reconcile with laboratory and/or environmental studies: laboratory and environmental studies can correlate with the analytic epidemiology studies. Together, they provide a complete picture of the outbreak investigation and guide appropriate public health action.
- Implement control and prevention measures: measures that target areas of the chain of infection are set in place, sometimes even before investigation begins.
- Initiate or maintain surveillance: continuing surveillance is important to determine whether the prevention and control measures are working in terms of declining number of cases; as well as checking whether the outbreak has spread to other areas where control measures would need to be initiated too.
- Communicate findings: summarization of the findings and its outcomes in a report, and communication of this report through oral briefing to local authorities and as a written report with a scientific format of introduction, background, methods, results, discussion, and recommendations. It is also published in public health literature to contribute to the knowledge base of epidemiology and public health.